Accuracy by Estimating the β in the SABR Hagan Approximation
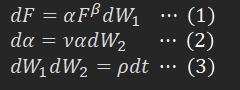
一般にSABRのパラメータβは固定値が使用されているが、βも推計対象とすることにより、描くボラティリティカーブの自由度を上げることができる。これによりキャリブレーションの精度が上がることを確認する。パラメータα、β、ρ、νについては下式(1)、(2)、(3)をご参照。
Generally, the SABR parameter β is used as a fixed value, but by making β an estimated
parameter, the flexibility of the volatility curve can be increased. We confirm that calibration
accuracy improves when β is estimated. For parameters(α, β, ρ, and ν), refer to Equations
(1), (2), and (3) below.
1. 実施方法/Research methoid
ここでは通貨オプションを対象に調査した数例を紹介する。
実際の市場ボラティリティデータに対し、SABRモデルのβ値を固定値と推計値とでキャリブレーションを実施し、各βの市場データへの適合具合の比較を行う。
Here we present several examples from our research conducted on FX options.
Calibration of the SABR model’s β values was performed using actual market volatility data,
comparing fixed values with estimated values to assess how well each β fits the market data.
1.1調査対象データ/Research data
| Currency pair | Date | Tenor | Volatility |
|---|---|---|---|
| EURUSD GBPUSD |
2020-Mar-17 2020-Mar-23 2024-Aug-05 |
2Y 10Y |
10-delta Put 25-delta Put ATM 25-delta Call 10-delta Call |
1.2 使用したβ値の種類/All perterns of β values used in this experiment
| β value | 備考/Remarks |
|---|---|
| 固定値/Ffixed values |
以下5種の固定値を使用。 The following five types are used as fixed values 0.1 0.3 0.5 0.7 0.9 |
| 推計値/Estimation | Currency pair, Tenor, Date毎に0≤β≤0.99 の範囲でα, ρ, νと同時にキャリブレーションを実行することにより推計。 Every β is estimated by simultaneously calibrating α, ρ, and ν within the range 0 ≤ β ≤ 0.99 for each currency pair, tenor, and date. |
1.3 キャリブレーション/Calibration
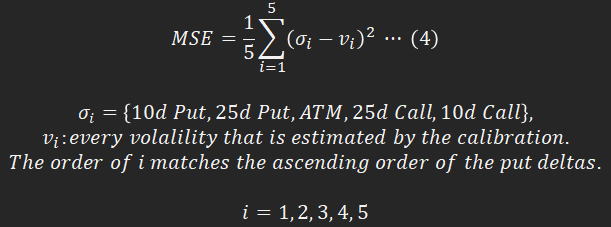
市場ボラティリティ10-delta Put, 25-delt Put, ATM, 25-delta Call, 10-delta Callの5点に対し、最小二乗法を適用してボラティリティカーブが適合するようキャリブレーションを実行する。各βの平均二乗誤差(MSE)で適合具合を比較する。数式は下記(4)。
Calibration is performed by applying least squares to fit the volatility curve to five points:
10-delta Put, 25-delta Put, ATM, 25-delta Call, and 10-delta Call. The comparison of fit is
performed using the mean squared error(MSE) for each β value. The formula is (4) below.
・使用プログラム言語/Programming language: Python
・使用ライブラリ/Library: least_squares() in Scipy.Optimize
・MSEの計算式は以下/The MSE calculation formula is as follows.
なお、最小二乗法実行時の各パラメータ初期値はDeep Neural Networkで事前に求めておくと収束の計算高速化が可能。関連情報リンク参照。
Furthermore, pre-computing initial values for each parameter using a Deep Neural
Network before executing the least squares method enables faster convergence
calculations. See related information links.
2. 調査結果/Research result
MSEの値を「2.1 結果-MSE/Result – MSE」に、推定パラメータとそのパラメータによるボラティリティカーブのチャートを「2.2 結果 – キャリブレーション/Result – Calibration」に掲載。
なお、グラフの横軸には行使価格をフォワード価格で除したマネネス値を使用。
The MSE value is shown in "2.1 Result – MSE". The estimated parameters and the
volatility curve chart based on those parameters are shown in "2.2 Result – Calibration".
Note that the horizontal axis of the graphs use the moneyness, which is the strike price divided by the forward price.
2.1 結果-MSE/Result – MSE
Table 3に最小二乗法によるキャリブレーションの平均二乗値を表示。全てβを推計したものが最良の適合となっている。当該日付をクリックするとキャリブレーション結果の図表へジャンプします。
Table 3 displays the mean squared error from least squares calibration. This shows the
estimation β method provide the best fit. Clicking the date will take you to the calibration
results chart.
| Date | β | |||||
|---|---|---|---|---|---|---|
| 0.1 | 0.3 | 0.5 | 0.7 | 0.9 | estimated β (MSE in lower tier) |
|
| EURUSD – 2Y | ||||||
| 2020Mar17 | 2.65E-07 | 1.49E-07 | 9.84E-08 | 1.13E-07 | 1.91E-07 | β = 0.56407 |
| 3.51E-08 | ||||||
| 2020Mar23 | 2.03E-06 | 1.35E-06 | 8.11E-07 | 4.22E-07 | 1.78E-07 | β = 0.99 |
| 3.00E-08 | ||||||
| 2024Aug05 | 7.14E-08 | 5.73E-08 | 4.62E-08 | 3.82E-08 | 3.33E-08 | β = 0.87341 |
| 5.76E-09 | ||||||
| EURUSD – 10Y | ||||||
| 2024Mar17 | 4.56E-06 | 2.40E-06 | 9.53E-07 | 1.78E-07 | 1.79E-08 | β = 0.85522 |
| 4.26E-09 | ||||||
| 2020Mar23 | 5.21E-06 | 8.29E-07 | 2.22E-07 | 5.99E-09 | 1.38E-07 | β = 0.71973 |
| 4.30E-09 | ||||||
| 2024Aug05 | 3.64E-07 | 2.30E-07 | 1.30E-07 | 6.26E-08 | 2.78E-08 | β = 0.99 |
| 2.26E-08 | ||||||
| GBPUSD – 2Y | ||||||
| 2020Mar17 | 8.60E-07 | 6.39E-07 | 4.50E-07 | 2.93E-07 | 1.70E-07 | β = 0.99 |
| 5.07E-08 | ||||||
| 2020Mar23 | 3.17E-06 | 2.24E-06 | 1.46E-06 | 8.54E-07 | 4.11E-07 | β = 0.99 |
| 1.57E-07 | ||||||
| 2024Aug05 | 1.04E-07 | 7.52E-08 | 5.08E-08 | 3.11E-08 | 1.61E-08 | β = 0.99 |
| 3.99E-09 | ||||||
| GBPUSD – 10Y | ||||||
| 2024Mar17 | 8.11E-06 | 4.87E-06 | 2.52E-06 | 1.04E-06 | 3.75E-07 | β = 0.988 |
| 3.12E-07 | ||||||
| 2020Mar23 | 2.14E-06 | 1.36E-06 | 7.56E-07 | 3.35E-07 | 8.94E-08 | β = 0.99 |
| 3.36E-08 | ||||||
| 2024Aug05 | 8.31E-07 | 5.46E-07 | 3.19E-07 | 1.51E-07 | 4.61E-08 | β = 0.99 |
| 1.90E-08 | ||||||
2.2. 結果 – キャリブレーション/Result – Calibration
各日付、通貨、テナー毎にキャリブレーションで得たα、ρ、νの値とそのボラティリティカーブを図表で表示する。
Here, we display the α, ρ, and ν values obtained through calibration for each date, currency,
and tenor, along with their volatility curves, in charts.
2.2.1 通貨ペアEURUSD/Currency pair EURUSD
2.2.1.1 通貨ペアEURUSD、日付2020年3月17日、期間2年の結果/Result for currency
pair EURUSD, date 2020-Mar-17 and tenor 2Y
各パラメータ値とMSE(再掲)はTable 4、ボラティリティカーブはFigure 1に掲示。
The MSE (repeated) and corresponding parameter values are shown in Table 4,
and the volatility curve is shown in Figure 1.
| β | ||||||
|---|---|---|---|---|---|---|
| 固定値 Fixed Value |
推計値 Estimated value |
|||||
| 0.1 | 0.3 | 0.5 | 0.7 | 0.9 | ||
| α | 0.0886174 | 0.0886088 | 0.0886438 | 0.0887223 | 0.0888439 | 0.0872790 |
| ρ | 0.1587550 | 0.1238850 | 0.0884456 | 0.0525815 | 0.0164465 | 0.0878156 |
| ν | 0.7151432 | 0.7094657 | 0.7048439 | 0.7012876 | 0.6988061 | 0.7980260 |
| β | - | - | - | - | - | 0.5640783 |
| MSE | 2.65E-07 | 1.49E-07 | 9.84E-08 | 1.13E-07 | 1.91E-07 | 3.51E-08 |
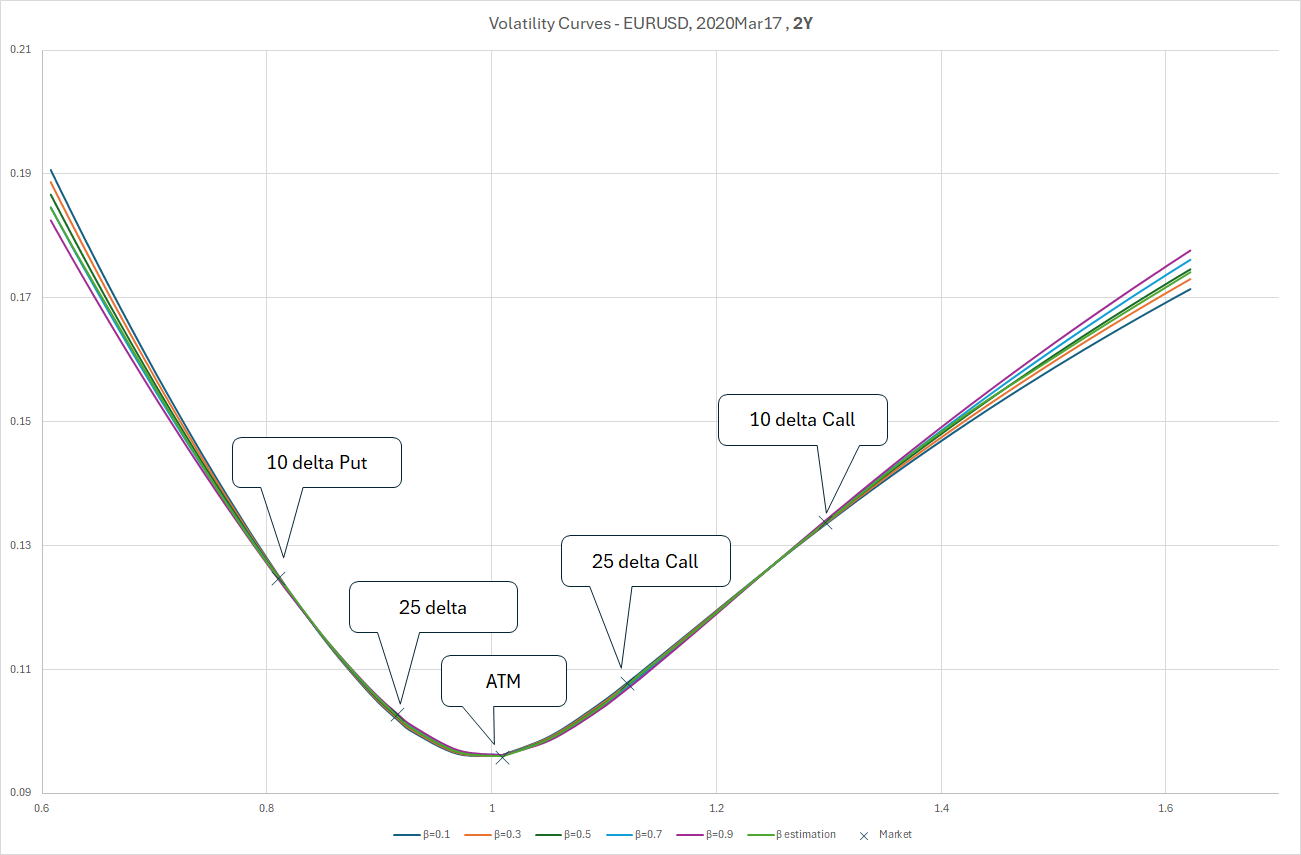
Figure 1 各βでのボラティリティカーブ/Volatility Curves for βs, EURUSD 2020Mar17 – 2Y
2.2.1.2 通貨ペアEURUSD、日付2020年3月23日、期間2年の結果/Result for currency pair
EURUSD, date 2020-Mar-17 and tenor 2Y
各パラメータ値とMSE(再掲)はTable 5、ボラティリティカーブはFigure 2に掲示。
The MSE (repeated) and corresponding parameter values are shown in Table 5, and the volatility curve is shown in Figure 2.
| β | ||||||
|---|---|---|---|---|---|---|
| 固定値 Fixed Value |
推計値 Estimated value |
|||||
| 0.1 | 0.3 | 0.5 | 0.7 | 0.9 | ||
| α | 0.1046996 | 0.104856 | 0.105090 | 0.105402 | 0.105793 | 0.105769 |
| ρ | -0.049419 | -0.09184 | -0.13376 | -0.17492 | -0.21508 | -0.27616 |
| ν | 0.7274384 | 0.730269 | 0.734629 | 0.740521 | 0.747948 | 0.894293 |
| β | - | - | - | - | - | 0.99 |
| MSE | 2.03E-06 | 1.34E-06 | 8.11E-07 | 4.22E-07 | 1.78E-07 | 3.00E-08 |
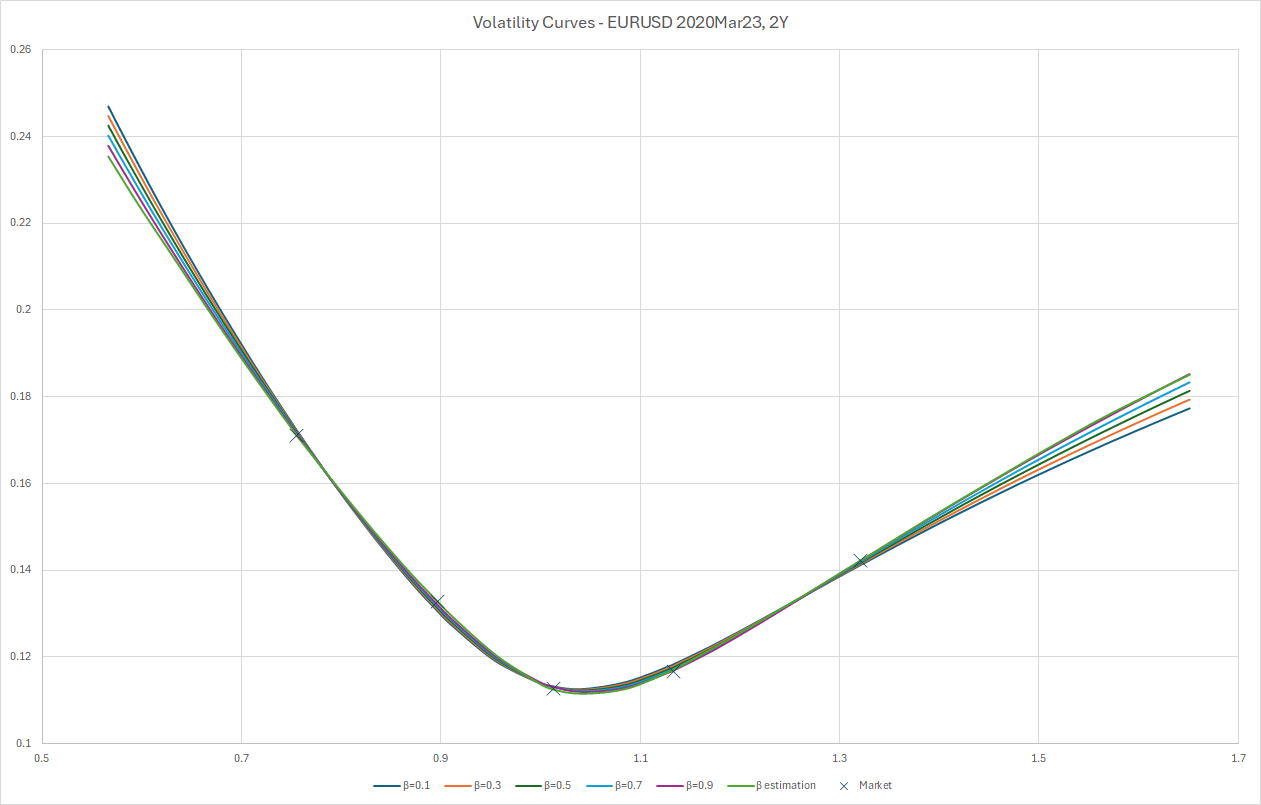
Figure 2 各βでのボラティリティカーブ/Volatility Curves for βs, EURUSD 2020Mar23 – 2Y
2.2.1.3 通貨ペアEURUSD、日付2024年8月5日、期間2年の結果/Result for currency pair
EURUSD, date 2024-Aug-5 and tenor 2Y
各パラメータ値とMSE(再掲)はTable 6、ボラティリティカーブはFigure 3に掲示。
The MSE (repeated) and corresponding parameter values are shown in Table 6, and
the volatility curve is shown in Figure 3
| β | ||||||
|---|---|---|---|---|---|---|
| 固定値 Fixed Value |
推計値 Estimated value |
|||||
| 0.1 | 0.3 | 0.5 | 0.7 | 0.9 | ||
| α | 0.066993 | 0.067035 | 0.067092 | 0.067166 | 0.067255 | 0.067164 |
| ρ | -0.137280 | -0.169156 | -0.200339 | -0.230760 | -0.260361 | -0.280344 |
| ν | 0.476047 | 0.480275 | 0.485019 | 0.490271 | 0.496022 | 0.522052 |
| β | - | - | - | - | - | 0.873410 |
| MSE | 7.14E-08 | 5.73E-08 | 4.62E-08 | 3.82E-08 | 3.33E-08 | 5.76E-09 |
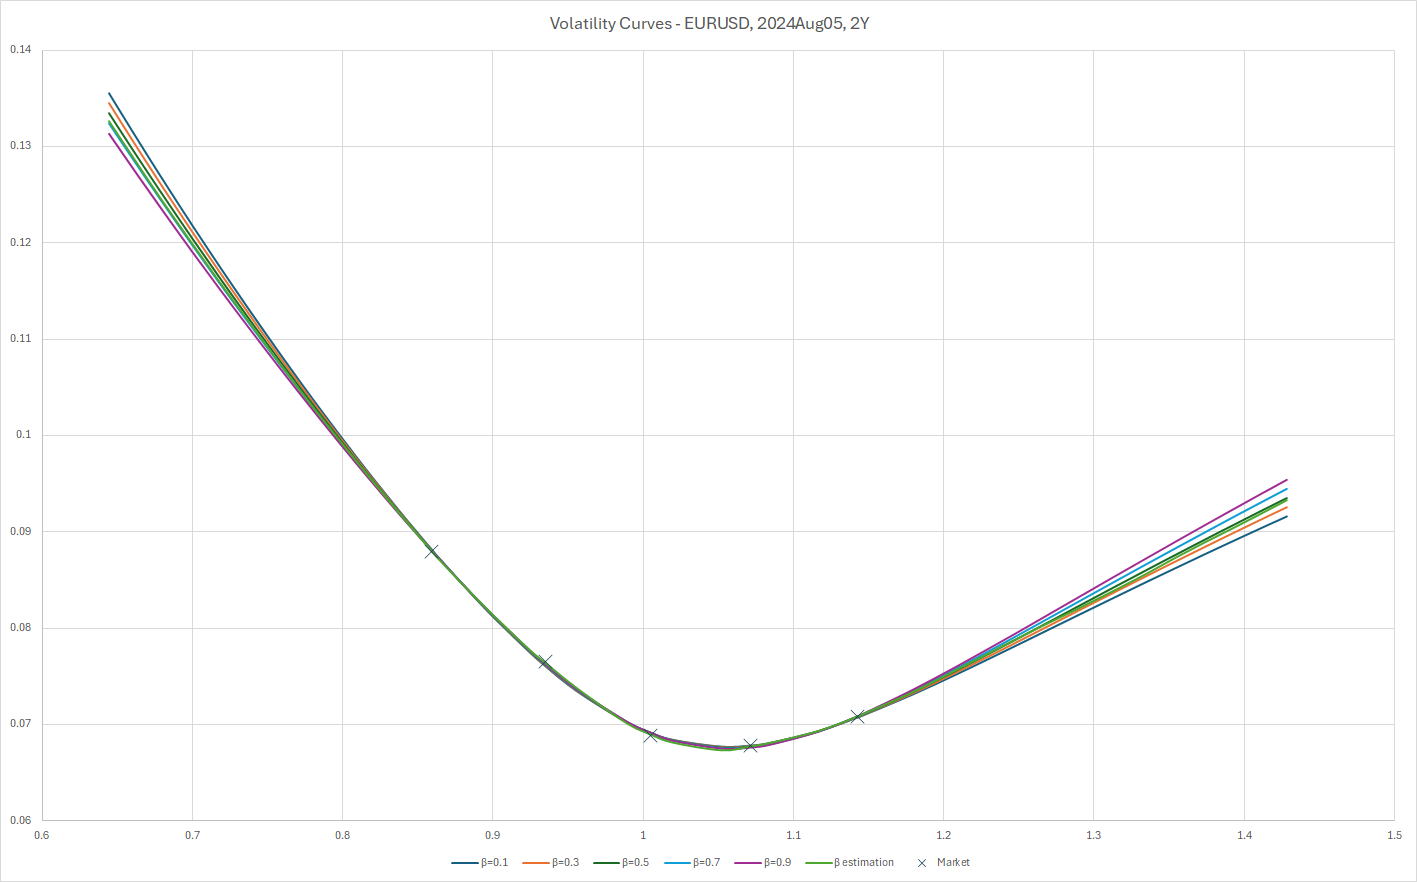
Figure 3 各βでのボラティリティカーブ/Volatility Curves for βs, EURUSD 2024Aug05 – 2Y
2.2.1.4 通貨ペアEURUSD、日付2020年3月17日、期間10年の結果/Result for currency pair
EURUSD, date 2020-Mar-17 and tenor 10Y
各パラメータ値とMSE(再掲)はTable 7、ボラティリティカーブはFigure 4に掲示。
The MSE (repeated) and corresponding parameter values are shown in Table 7,
and the volatility curve is shown in Figure 4.
| β | ||||||
|---|---|---|---|---|---|---|
| 固定値 Fixed Value |
推計値 Estimated value |
|||||
| 0.1 | 0.3 | 0.5 | 0.7 | 0.9 | ||
| α | 0.0955967 | 0.097755 | 0.0980250 | 0.0985734 | 0.0994000 | 0.0986426 |
| ρ | 0.25 | 0.2254456 | 0.1403201 | 0.0510548 | -0.040192 | 0.0420985 |
| ν | 0.3285460 | 0.306530 | 0.298169 | 0.2925422 | 0.2897665 | 0.2921396 |
| β | - | - | - | - | - | 0.719739 |
| MSE | 5.21E-06 | 8.29E-07 | 2.22E-07 | 5.99E-09 | 1.38E-07 | 4.30E-09 |
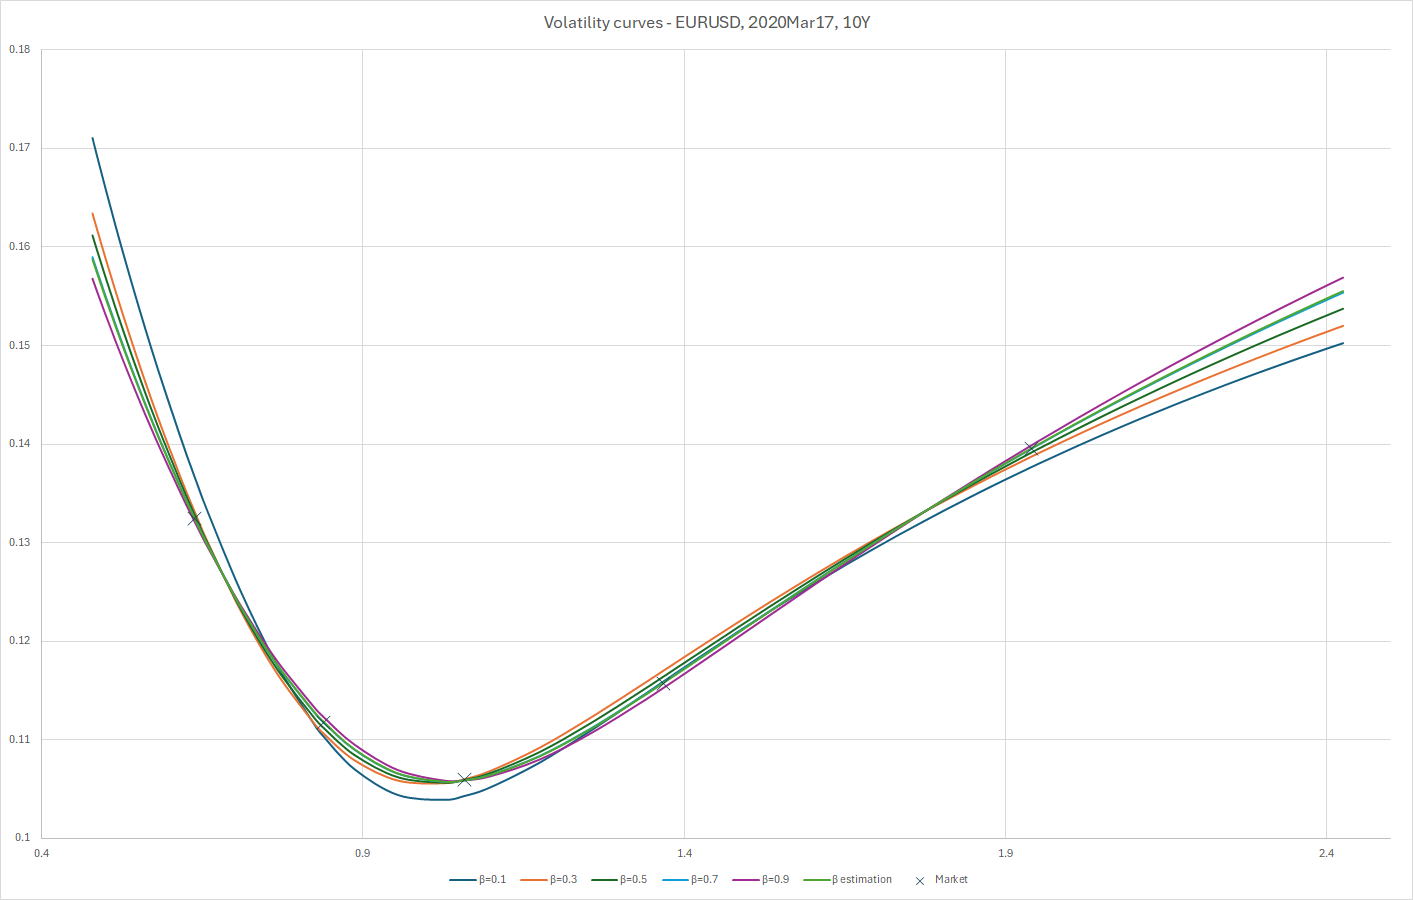
Figure 4 各βでのボラティリティカーブ/Volatility Curves for βs, EURUSD 2020 Mar17 – 10Y
2.2.1.5 通貨ペアEURUSD、日付2020年3月23日、期間10年の結果/Result for currency pair
EURUSD, date 2020-Mar-23 and tenor 10Y
各パラメータ値とMSE(再掲)はTable 8、ボラティリティカーブはFigure 5に掲示。
The MSE (repeated) and corresponding parameter values are shown in Table 8,
and the volatility curve is shown in Figure 5.
| β | ||||||
|---|---|---|---|---|---|---|
| 固定値 Fixed Value |
推計値 Estimated value |
|||||
| 0.1 | 0.3 | 0.5 | 0.7 | 0.9 | ||
| α | 0.1116597 | 0.1118868 | 0.1125537 | 0.1136665 | 0.1152402 | 0.1148467 |
| ρ | 0.2094328 | 0.1109741 | 0.0083961 | -0.095003 | -0.195579 | -0.173495 |
| ν | 0.3133973 | 0.3058507 | 0.3018558 | 0.301556 | 0.3050857 | 0.3039567 |
| β | - | - | - | - | - | 0.8552229 |
| MSE | 4.56E-06 | 2.40E-06 | 9.53E-07 | 1.77E-07 | 1.78E-08 | 4.25-09 |
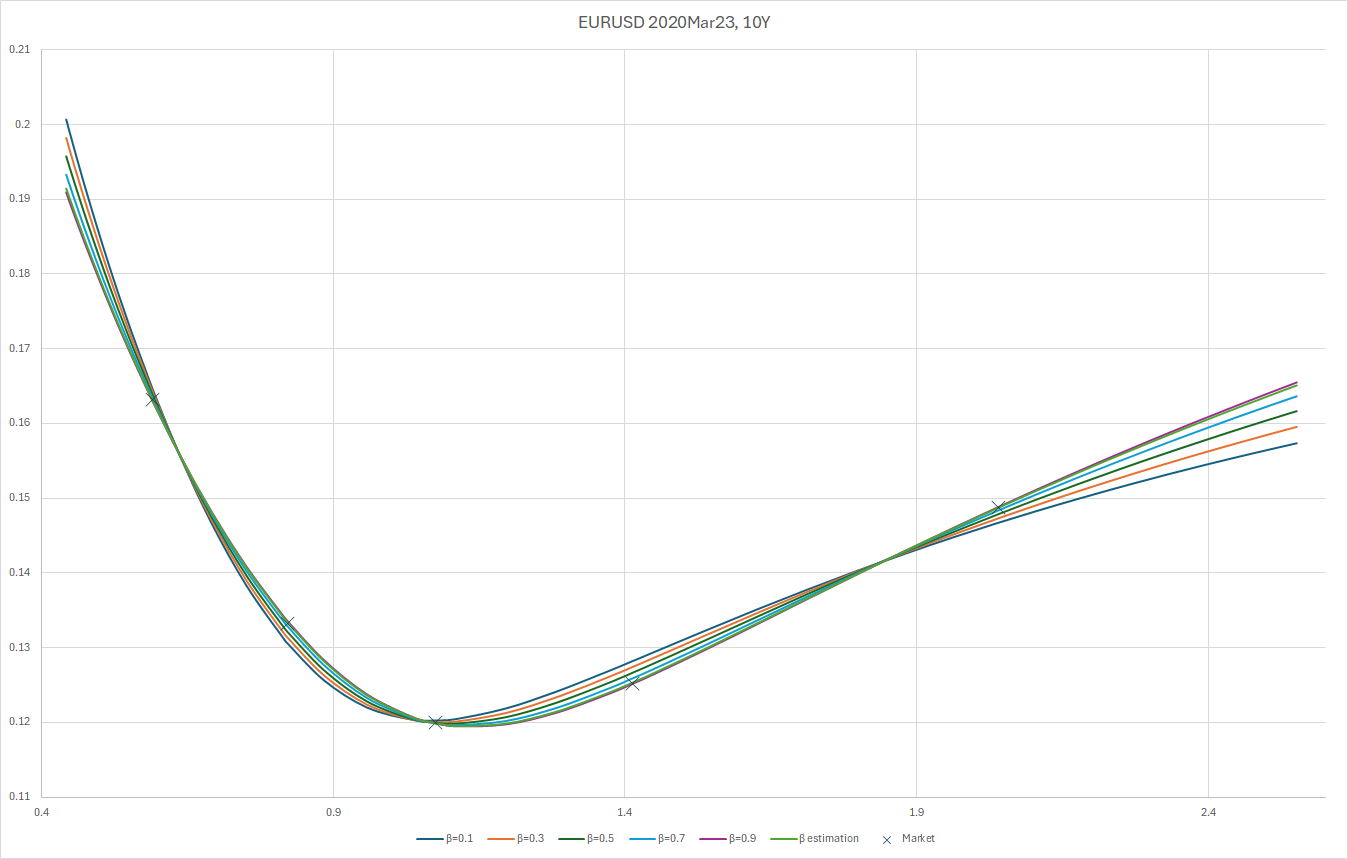
Figure 5 各βでのボラティリティカーブ/Volatility Curves for βs, 10Y
2.2.1.6 通貨ペアEURUSD、日付2024年8月05日、期間10年の結果/Result for currency pair
EURUSD, date 2024-Aug-05 and tenor 10Y
各パラメータ値とMSE(再掲)はTable 9、ボラティリティカーブはFigure 6に掲示。
The MSE (repeated) and corresponding parameter values are shown in Table 9,
and the volatility curve is shown in Figure 6.
| β | ||||||
|---|---|---|---|---|---|---|
| 固定値 Fixed Value |
推計値 Estimated value |
|||||
| 0.1 | 0.3 | 0.5 | 0.7 | 0.9 | ||
| α | 0.0793812 | 0.079405 | 0.079560 | 0.079849 | 0.080274 | 0.080511 |
| ρ | 0.1415334 | 0.055501 | -0.03110 | -0.11638 | -0.19857 | -0.23412 |
| ν | 0.2209444 | 0.219789 | 0.220354 | 0.222641 | 0.226634 | 0.228978 |
| β | - | - | - | - | - | 0.99 |
| MSE | 3.63E-07 | 2.30E-07 | 1.30E-07 | 6.25E-08 | 2.77E-08 | 2.26E-08 |
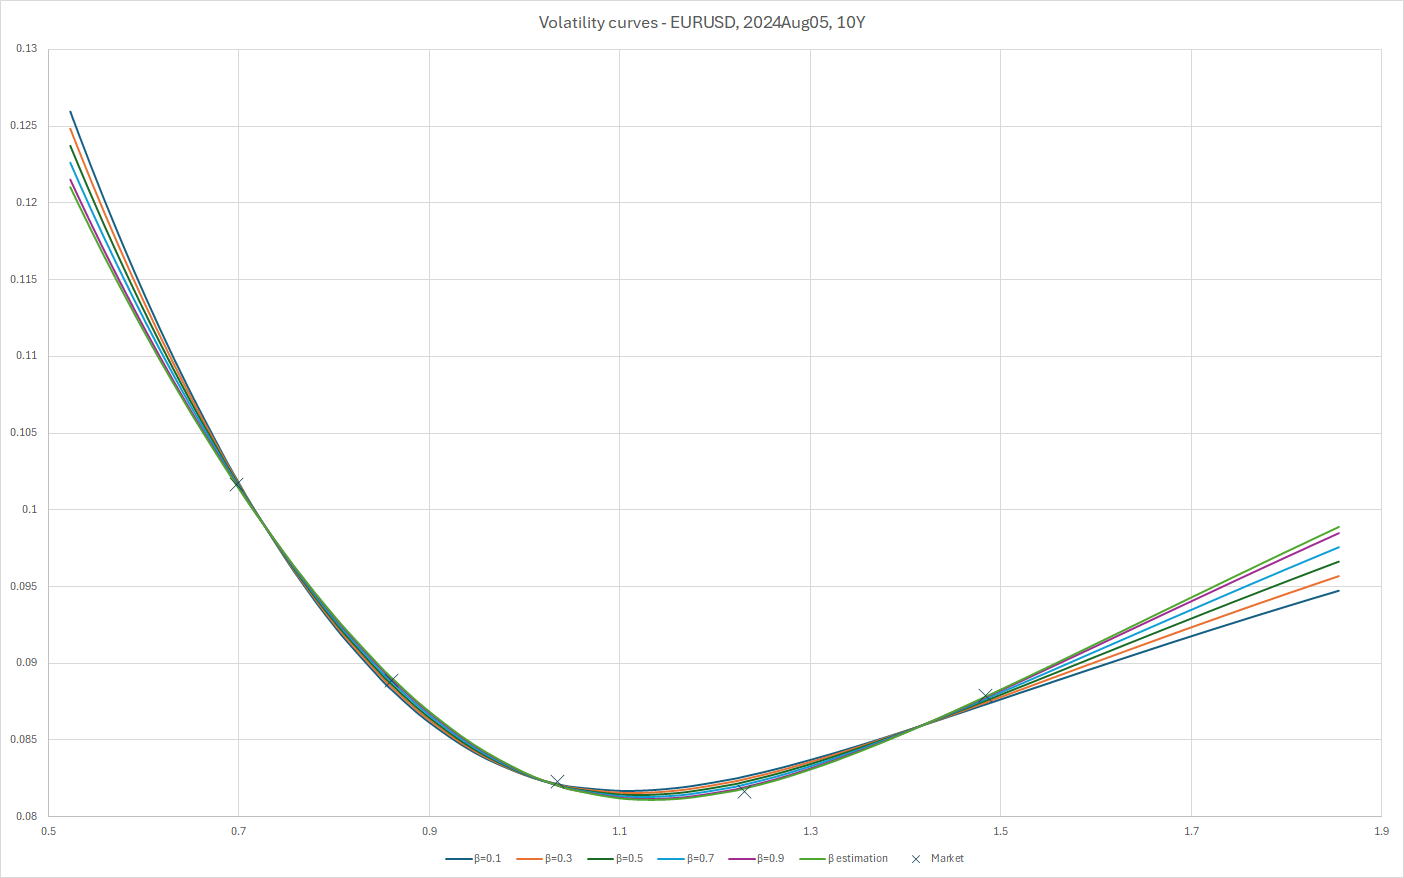
Figure 6 各βでのボラティリティカーブ/Volatility Curves for βs, EURUSD 2024Aug05 – 10Y
2.2.2 通貨ペア GBPUSD/Currency pair GBPUSD
2.2.2.1 通貨ペアGBPUSD、日付2020年3月17日、期間2年の結果/Result for currency pair
GBPUSD, date 2020-Mar-17 and tenor 2Y
各パラメータ値とMSE(再掲)はTable 10、ボラティリティカーブはFigure 7に掲示。
The MSE (repeated) and corresponding parameter values are shown in Table 10,
and the volatility curve is shown in Figure 7.
| β | ||||||
|---|---|---|---|---|---|---|
| 固定値 Fixed Value |
推計値 Estimated value |
|||||
| 0.1 | 0.3 | 0.5 | 0.7 | 0.9 | ||
| α | 0.1063731 | 0.1064759 | 0.1066457 | 0.1068839 | 0.1071921 | 0.1076086 |
| ρ | -0.073635 | -0.122015 | -0.169240 | -0.215038 | -0.259176 | -0.303706 |
| ν | 0.5340614 | 0.5390441 | 0.5453560 | 0.5529789 | 0.5618921 | 0.6136805 |
| β | - | - | - | - | - | 0.99 |
| MSE | 8.60E-07 | 6.39E-07 | 4.50E-07 | 2.93E-07 | 1.69E-07 | 5.06E-08 |
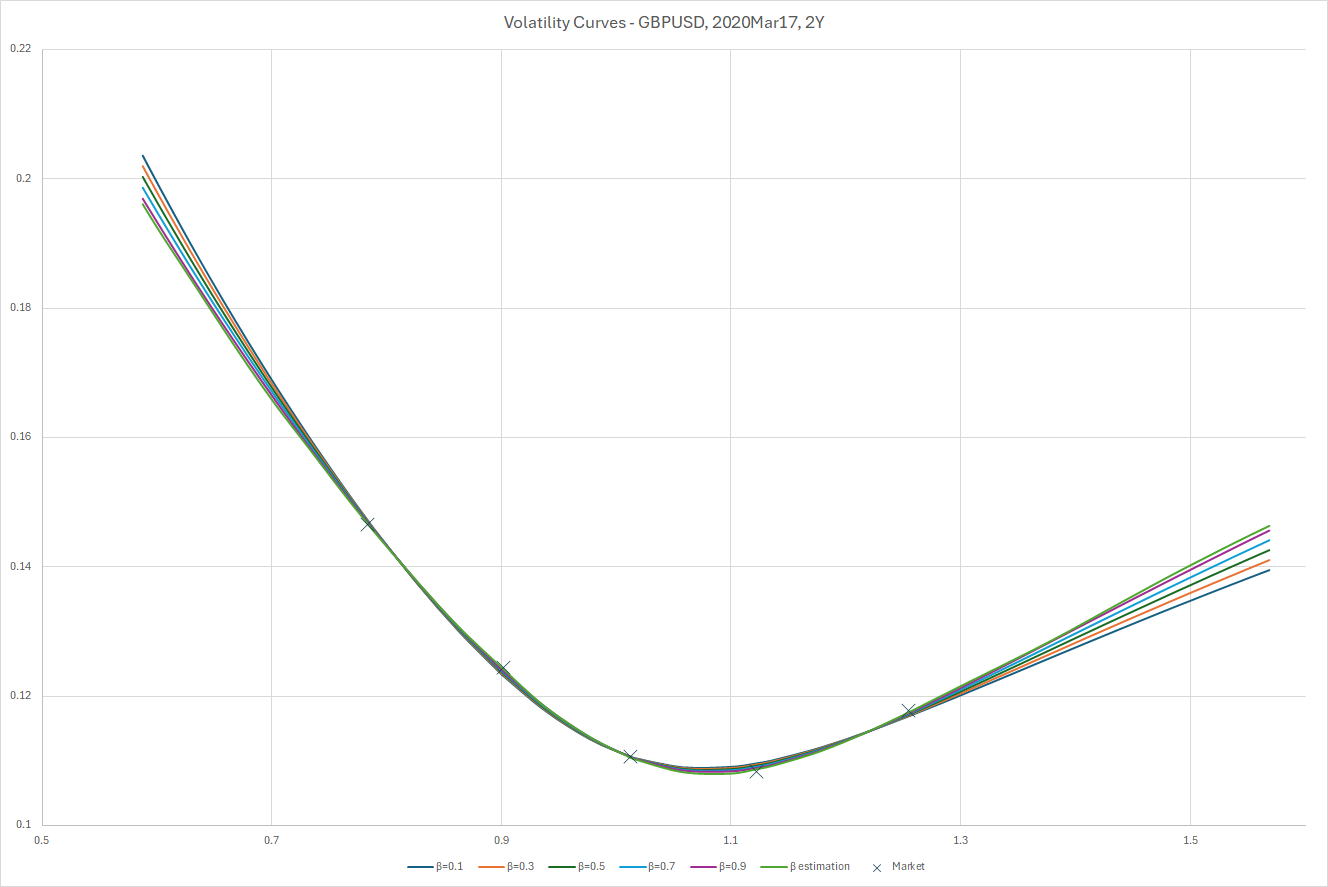
Figure 7 各βでのボラティリティカーブ/Volatility Curves for βs, GBPUSD 2020Mar17 – 2Y
2.2.2.2 通貨ペアGBPUSD、日付2020年3月23日、期間2年の結果/Result for currency pair
GBPUSD, date 2020-Mar-23 and tenor 2Y
各パラメータ値とMSE(再掲)はTable 11、ボラティリティカーブはFigure 8に掲示。
The MSE (repeated) and corresponding parameter values are shown in Table 11,
and the volatility curve is shown in Figure 8.
| β | ||||||
|---|---|---|---|---|---|---|
| 固定値 Fixed Value |
推計値 Estimated value |
|||||
| 0.1 | 0.3 | 0.5 | 0.7 | 0.9 | ||
| α | 0.129887 | 0.130126 | 0.130502 | 0.131018 | 0.131680 | 0.133477 |
| ρ | -0.082347 | -0.136886 | -0.189964 | -0.241165 | -0.290131 | -0.353501 |
| ν | 0.630318 | 0.636680 | 0.645118 | 0.655619 | 0.668171 | 0.763027 |
| β | - | - | - | - | - | 0.99 |
| MSE | 3.17E-06 | 2.23E-06 | 1.46E-06 | 8.54-07 | 4.11E-07 | 1.56E-07 |
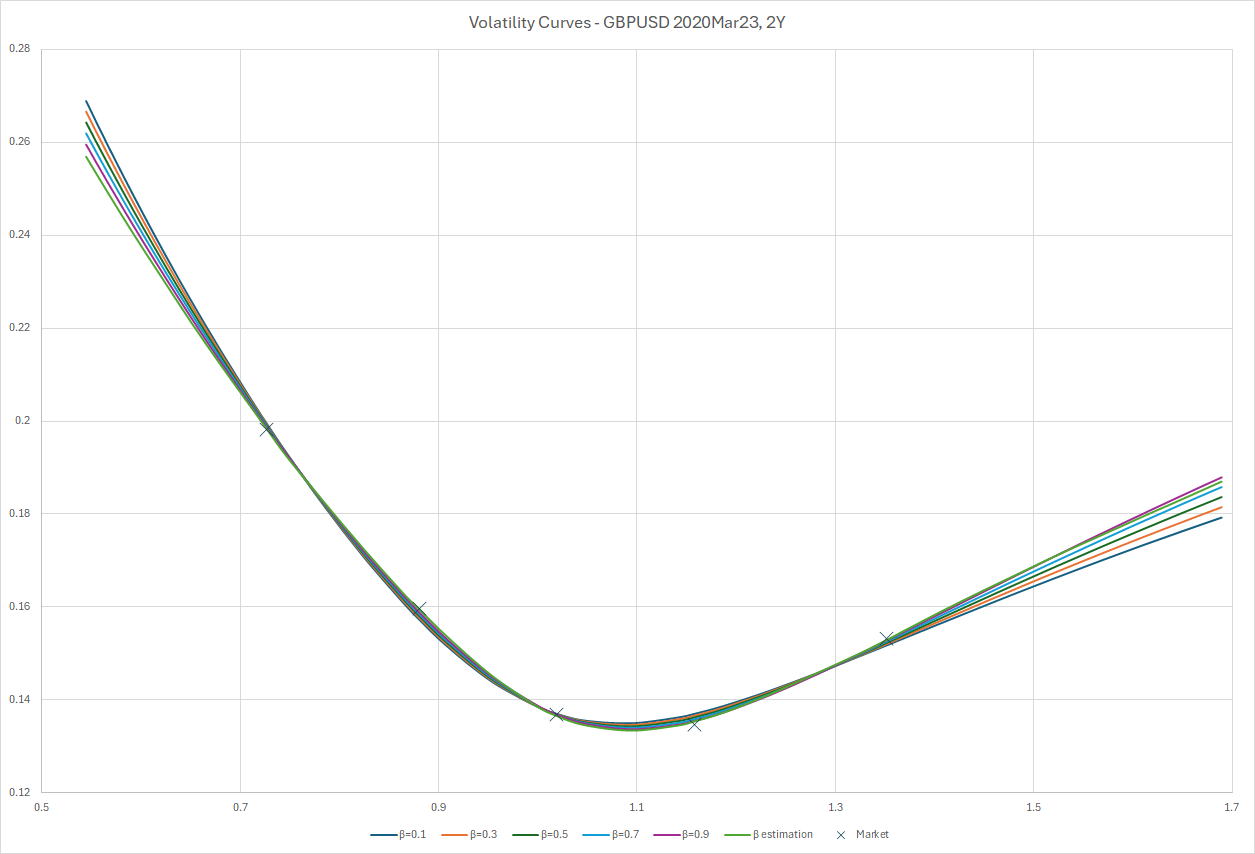 Figure 8 各βでのボラティリティカーブ/Volatility Curves for βs, GBPUSD 2020Mar23 – 2Y
2.2.2.3 通貨ペアGBPUSD、日付2024年8月05日、期間2年の結果/Result for currency pair
GBPUSD, date 2024-Aug-05 and tenor 2Y
各パラメータ値とMSE(再掲)はTable 12、ボラティリティカーブはFigure 9に掲示。
The MSE (repeated) and corresponding parameter values are shown in Table 12,
and the volatility curve is shown in Figure 9.
| β | ||||||
|---|---|---|---|---|---|---|
| 固定値 Fixed Value |
推計値 Estimated value |
|||||
| 0.1 | 0.3 | 0.5 | 0.7 | 0.9 | ||
| α | 0.077863 | 0.077919 | 0.078000 | 0.078105 | 0.078236 | 0.078385 |
| ρ | -0.133195 | -0.171142 | -0.208075 | -0.243885 | -0.278485 | -0.314048 |
| ν | 0.459940 | 0.464962 | 0.470682 | 0.477085 | 0.484157 | 0.516257 |
| β | - | - | - | - | - | 0.99 |
| MSE | 1.04E-07 | 7.52E-08 | 5.08E-08 | 3.11E-08 | 1.61E-08 | 3.99E-09 |
Figure 9 各βでのボラティリティカーブ/Volatility Curves for βs, GBPUSD 2020Mar23 – 2Y2.2.2.4 通貨ペアGBPUSD、日付2020年3月17日、期間10年の結果/Result for currency pair
GBPUSD, date 2020-Mar-17 and tenor 10Y
各パラメータ値とMSE(再掲)はTable 13、ボラティリティカーブはFigure 10に掲示。
The MSE (repeated) and corresponding parameter values are shown in Table 13
and the volatility curve is shown in Figure 10.
| β | ||||||
|---|---|---|---|---|---|---|
| 固定値 Fixed Value |
推計値 Estimated value |
|||||
| 0.1 | 0.3 | 0.5 | 0.7 | 0.9 | ||
| α | 0.1161850 | 0.1161927 | 0.1166234 | 0.1174878 | 0.1188111 | 0.1195668 |
| ρ | 0.2444597 | 0.1233841 | -0.001775 | -0.125492 | -0.242384 | -0.291560 |
| ν | 0.2312569 | 0.226898 | 0.226167 | 0.229133 | 0.235784 | 0.2399601 |
| β | - | - | - | - | - | 0.99 |
| MSE | 2.14E-06 | 1.35E-06 | 7.56E-07 | 3.35E-07 | 8.93E-08 | 3.36E-08 |
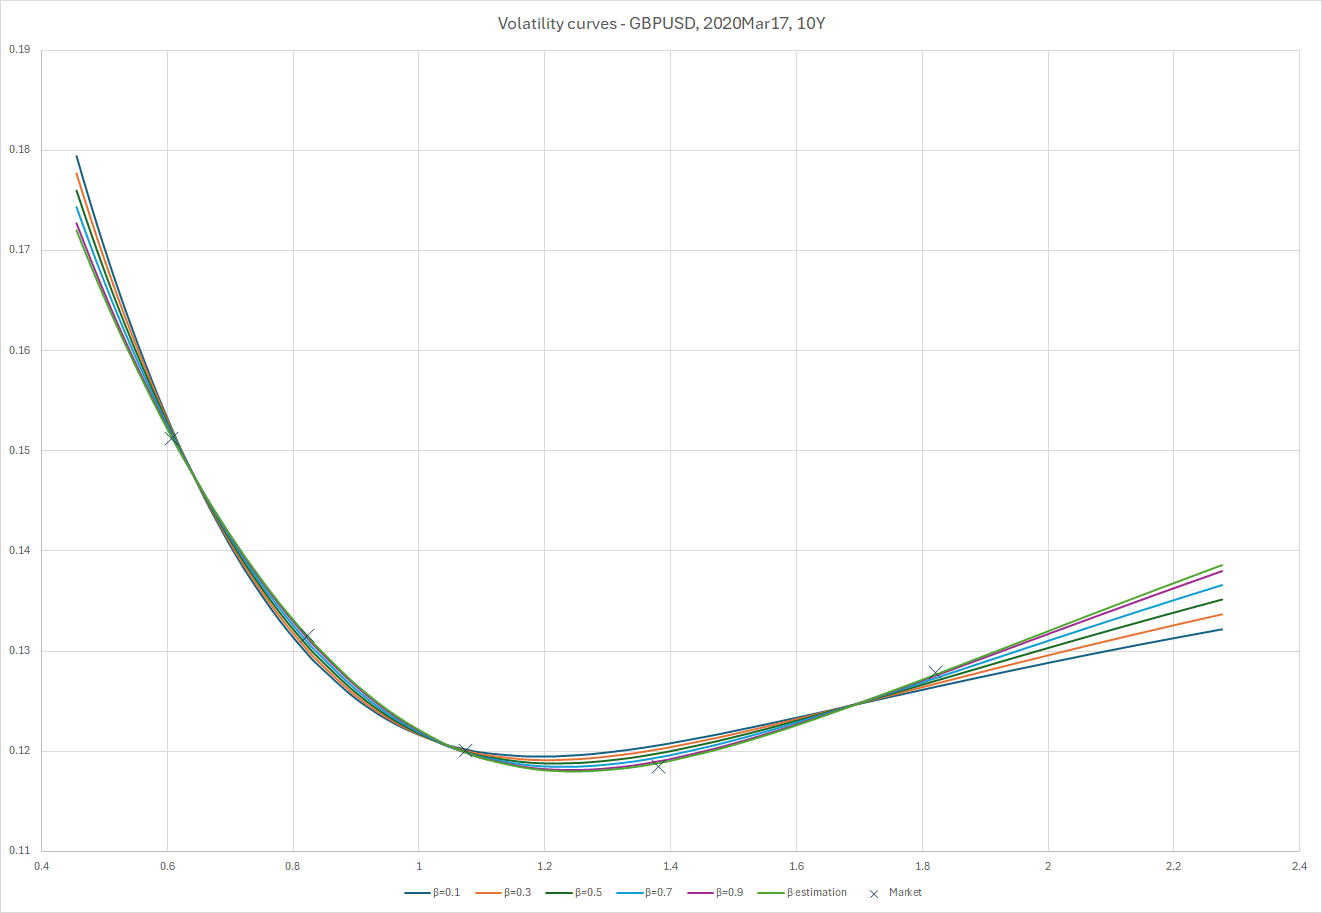
Figure 10 各βでのボラティリティカーブ/Volatility Curves for βs, GBPUSD 2020Mar17 – 10Y
2.2.2.5 通貨ペアGBPUSD、日付2020年3月23日、期間10年の結果/Result for currency pair
GBPUSD, date 2020-Mar-23 and tenor 10Y
各パラメータ値とMSE(再掲)はTable 14、ボラティリティカーブはFigure 11に掲示。
The MSE (repeated) and corresponding parameter values are shown in Table 14,
and the volatility curve is shown in Figure 11.
| β | ||||||
|---|---|---|---|---|---|---|
| 固定値 Fixed Value |
推計値 Estimated value |
|||||
| 0.1 | 0.3 | 0.5 | 0.7 | 0.9 | ||
| α | 0.1336118 | 0.1339935 | 0.1351209 | 0.137028 | 0.1397827 | 0.1412793 |
| ρ | 0.1906938 | 0.0644595 | -0.0646379 | -0.190341 | -0.3066331 | -0.353266 |
| ν | 0.2852673 | 0.2801124 | 0.2798579 | 0.2846818 | 0.2947225 | 0.3007906 |
| β | - | - | - | - | - | 0.99 |
| MSE | 8.10E-06 | 4.87E-06 | 2.52E-06 | 1.04E-06 | 3.74E-07 | 3.11E-07 |
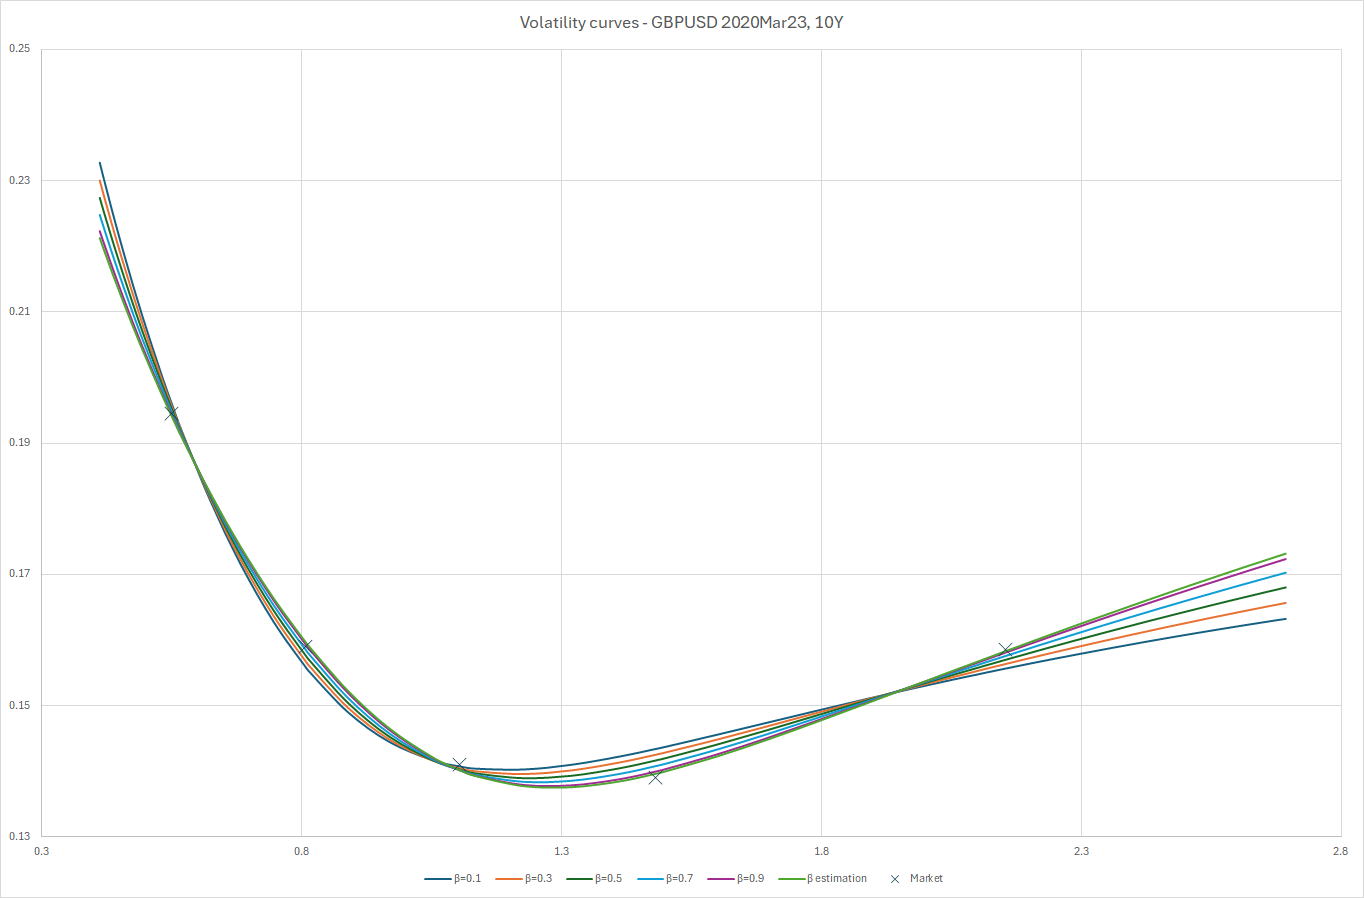 Figure 11 各βでのボラティリティカーブ/Volatility Curves for βs, GBPUSD 2020Mar23 – 10Y
2.2.2.6 通貨ペアGBPUSD、日付2024年8月5日、期間10年の結果/Result for currency pair
GBPUSD, date 2024-Aug-5 and tenor 10Y
各パラメータ値とMSE(再掲)はTable 15、ボラティリティカーブはFigure 12に掲示。
The MSE (repeated) and corresponding parameter values are shown in Table 15,
and the volatility curve is shown in Figure 12.
| β | ||||||
|---|---|---|---|---|---|---|
| 固定値 Fixed Value |
推計値 Estimated value |
|||||
| 0.1 | 0.3 | 0.5 | 0.7 | 0.9 | ||
| α | 0.099140 | 0.099238 | 0.099593 | 0.100217 | 0.101127 | 0.101636 |
| ρ | 0.112171 | -0.004466 | -0.118152 | -0.225147 | -0.322717 | -0.363089 |
| ν | 0.201548 | 0.202943 | 0.207012 | 0.213684 | 0.222847 | 0.227751 |
| β | - | - | - | - | - | 0.99 |
| MSE | 8.31E-07 | 5.46E-07 | 3.19E-07 | 1.51E-07 | 4.61E-08 | 1.90E-08 |
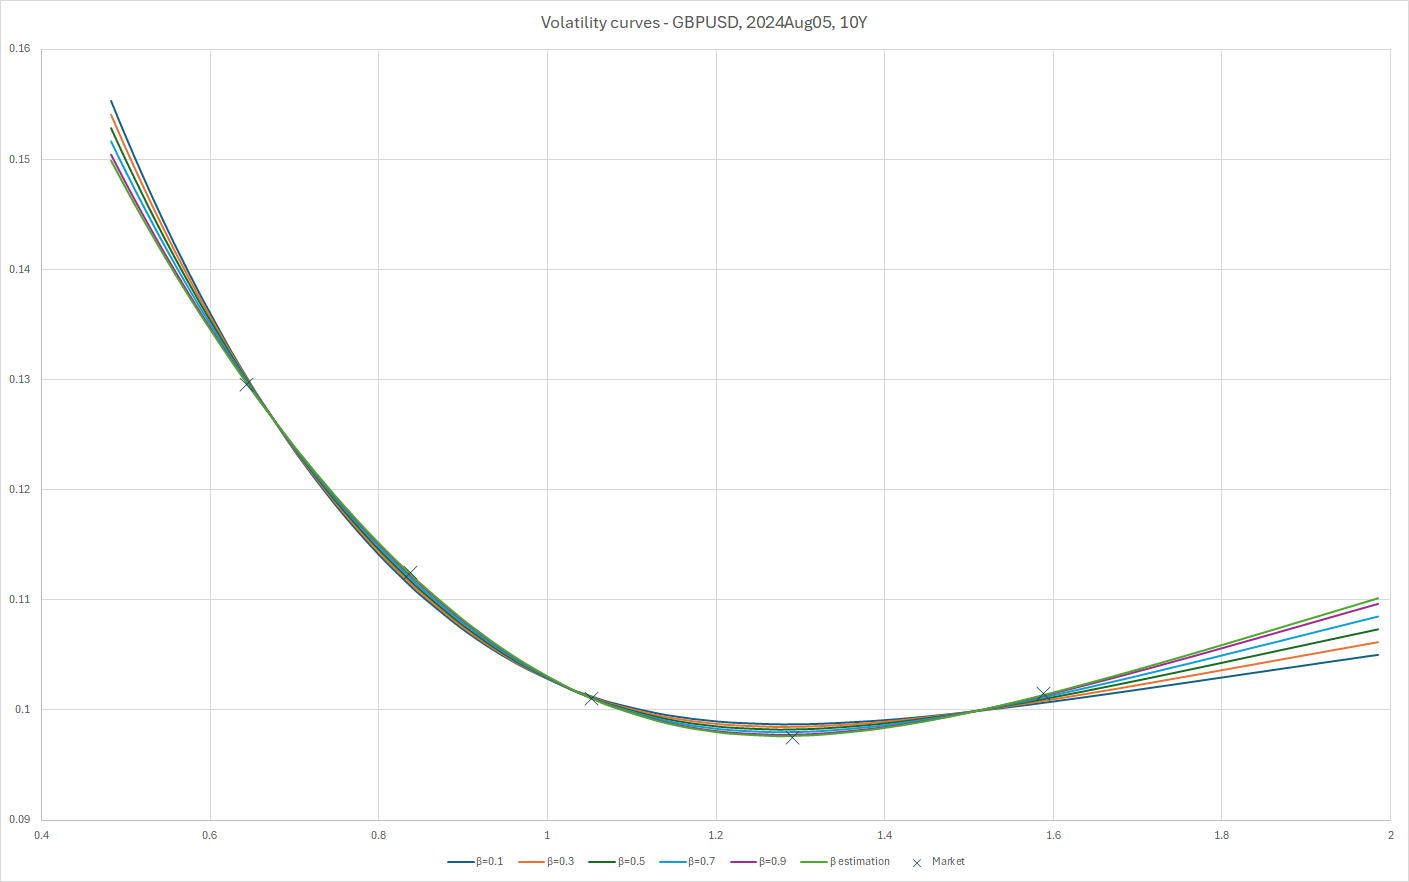 Figure 12 各βでのボラティリティカーブ/Volatility Curves for βs, GBPUSD 2024Aug – 10